Unveiling the BCG Matrix of Nestle: A Comprehensive Guide
In the dynamic realm of global business, understanding a company’s portfolio and its strategic positioning can significantly enhance its marketing strategy and overall market performance. The BCG matrix, a renowned analytical tool in marketing, provides invaluable insights into this area. Specifically, the BCG matrix of Nestle sheds light on how this leading multinational corporation navigates its vast array of products through complex market dynamics. By systematically categorizing its diverse product lines, Nestle leverages the BCG matrix not only to refine its marketing mix but also to bolster its marketing strategy, thereby ensuring sustained growth and competitiveness in the global market.
This comprehensive guide delves into the intricacies of the BCG matrix as it applies to Nestle, starting from a detailed overview of the BCG matrix itself to how Nestle’s product categories are meticulously placed within this strategic framework. The subsequent sections will unravel the strategic implications these placements have for Nestle and outline practical lessons drawn for other companies aiming to optimize their marketing strategies using the BCG matrix analysis. By exploring the alignment of Nestle’s marketing strategy with its product categorization in the BCG matrix, readers will gain a profound understanding of how theoretical marketing tools are translated into actionable strategies in the complex landscape of international business.
Overview of the BCG Matrix
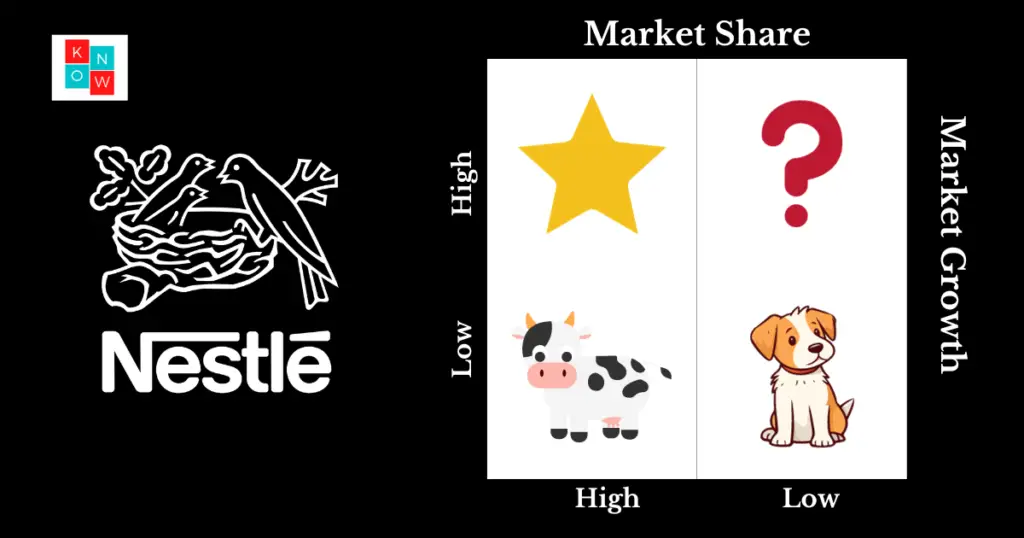
The BCG Matrix, developed by the Boston Consulting Group in 1970, serves as a strategic tool for managing a company’s portfolio of products or services. It categorizes these into four distinct quadrants based on market growth and market share, which are represented on a two-axis graph: one axis for market growth and the other for market share.
Key Components of the BCG Matrix

- Market Growth Rate: This vertical axis measures the potential growth of a product category within its market. High growth rates, typically above 10%, suggest a rapidly expanding market, whereas rates below 10% indicate a mature or slow-growing market.
- Market Share: The horizontal axis reflects the relative market share of a product compared to the largest competitor in the industry. A high market share implies a dominant position that can potentially yield cost advantages due to economies of scale.
Quadrants of the BCG Matrix
- Stars: Products in this quadrant have high market growth and high market share. They are well-positioned and should receive substantial investment to maintain or enhance their status.
- Question Marks: These are products with high market growth but low market share. Strategic decisions are crucial for these products, which may become Stars or could require divestment.
- Cash Cows: With low market growth but high market share, these products generate steady cash flow. The strategy typically involves maintaining or milking these products to fund other segments.
- Dogs: Products in this quadrant have both low market growth and low market share. They usually represent a drain on resources and may be candidates for divestiture or repositioning.
By applying the BCG Matrix, companies can prioritize resource allocation among different business units, helping to optimize their overall portfolio for better financial performance and strategic alignment.
Nestlé's Product Categories and Their Placement in the BCG Matrix
Cash Cows in Nestlé's Portfolio
- Maggi Noodles: Dominating with a market share of 80-85%, Maggi Noodles is a significant cash cow for Nestlé. Its widespread popularity and minimal investment requirement make it a stable revenue source.
- Nescafé and Chocolates (KitKat, Munch): These products, with their extensive market penetration and high customer loyalty, require little investment while offering consistent profitability.
Stars in Nestlé's Portfolio
- Nestlé Mineral Water and Nescafé Coffee Variants (e.g., Nescafé Latte): These products are positioned in the star quadrant due to their high market presence and growth potential. Strategic investments are suggested to transition these stars into cash cows.

Question Marks in Nestlé's Portfolio
- Milk Products (Nestlé Everyday, Nestlé Slim, Nestlé Milkmaid): These products face steep competition and are in the development phase, requiring significant investments without guaranteed returns.
- Innovative Products (É by Nescafé): Aimed at revolutionizing coffee-making, these products need substantial investment to capture market interest and potentially move to the star quadrant.
Dogs in Nestlé's Portfolio
- Milo and Koko Crunch: These products have struggled to secure a substantial market presence, leading to minimal returns on the investments made. They are positioned in the dog quadrant, indicating a potential divestiture or repositioning strategy might be necessary.
Strategic Implications for Nestlé Based on the BCG Matrix
Resource Allocation Strategies
- Optimizing Marketing Channels: Nestlé utilizes the BCG matrix to strategically allocate resources across various marketing channels. This approach aids in maximizing the expected ROI, particularly in high-growth areas like organic search (SEO), which is beneficial for products in the ‘Stars’ quadrant such as Nescafé and Nestlé Waters.
- Tailored Strategies for Each Quadrant: Depending on the quadrant, Nestlé applies specific strategies—Build, Hold, Harvest, and Divest. For instance, the ‘Cash Cows’ like Maggi Noodles require minimal investment but need strategies to maintain market dominance.
Investment and Divestment Decisions
- Investing in Stars for Future Growth: Products like Nescafé Latte, which show high market growth and share, receive significant investments. This strategic funding is aimed at transitioning these ‘Stars’ into ‘Cash Cows’, thereby securing a long-term profitable status.
- Managing Low Performers: For products in the ‘Dogs’ quadrant, such as Milo, Nestlé evaluates the feasibility of continued investment. The focus is on minimizing losses by considering divestiture or repositioning strategies to better allocate resources to more profitable segments.
Lessons for Other Companies from Nestlé's BCG Matrix Analysis
Adopting the BCG Matrix for Diverse Product Portfolios
Nestlé, a leading FMCG company, operates in about 187 countries, catering to a vast array of market segments and strategies. The company’s success in managing its broad brand portfolio across diverse markets worldwide can be attributed to its effective use of the BCG matrix. This strategic tool has allowed Nestlé to identify Cash Cows like Maggi Noodles and Nescafé, which require minimal investment yet generate significant revenue due to high market share and customer loyalty. Similarly, Nestlé has successfully pinpointed Stars with potential for greater ROI, such as Nestlé Mineral Water and Nescafé Coffee variants, indicating the importance of investing in high-growth products.
- Understanding Market Dynamics: Other companies can learn from Nestlé’s approach to continuously analyze market dynamics and customer preferences, ensuring the BCG matrix remains relevant in the changing digital landscape.
- Strategic Resource Allocation: By categorizing products into Cash Cows, Stars, Question Marks, and Dogs, companies can make informed decisions on where to allocate resources for maximum impact.
Balancing Short-term Profits with Long-term Growth
Nestlé’s strategic positioning of products within the BCG matrix underscores the importance of balancing short-term profits with the pursuit of long-term growth. Products in the Question Mark category, such as Nestlé Everyday and innovative offerings like É by Nescafé, highlight the necessity of investing in development phases despite the high risk. This approach can potentially transform these products into Stars or Cash Cows, contributing to the company’s future success.
- Investment in Innovation: Companies should consider investing in innovative products and market segments with growth potential, even if it involves significant initial investment and risk.
- Portfolio Diversification: Maintaining a diversified product portfolio with items in each quadrant of the BCG matrix ensures a healthy cash flow and prepares the company to capitalize on future market trends.
By analyzing Nestlé’s application of the BCG matrix, other companies can gain insights into strategic portfolio management, emphasizing the need for a well-rounded approach to product categorization, investment, and resource allocation. This strategy not only aids in achieving short-term financial goals but also sets the foundation for long-term market leadership and growth.
Conclusion
Throughout this comprehensive exploration of the BCG matrix as applied to Nestle, we have delved deeply into the strategic categorization of the company’s diverse product range, shedding light on the quadrants of Cash Cows, Stars, Question Marks, and Dogs. These analytical insights offer a lucid framework for Nestle, enabling the company to adeptly navigate its vast portfolio in the swiftly evolving global market landscape. The analysis underlines the criticality of strategic resource allocation, investment in high-potential areas, and the judicious management of underperforming segments to sustain growth and competitiveness.
Drawing from Nestle’s strategic application of the BCG matrix, other companies can garner valuable lessons in optimizing their portfolios through similarly insightful categorization and strategic focus. The significance of balancing immediate profitability with investments aimed at long-term growth stands out as a pivotal strategy. Through such a balanced approach, companies, much like Nestle, are better positioned to not only achieve robust financial performance but also to ensure enduring relevance and leadership in their respective markets, laying a solid groundwork for future innovations and growth opportunities.
FAQs
Understanding the BCG Matrix of Nestle
1. What exactly is the BCG Matrix and how does it apply to Nestle?
The BCG Matrix, also known as the growth-share matrix, is a strategic tool utilized by companies like Nestle to categorize their various business units or products into four distinct groups: Dogs, Stars, Cash Cows, and Question Marks. This classification helps Nestle in strategic planning and resource allocation across its diverse product range.
2. In the context of Nestle’s BCG Matrix, what are referred to as “Dogs”?
Within Nestle’s BCG Matrix, “Dogs” represent products that possess a low market share or limited growth potential. An example of this would be Milo, a chocolate and malt powder introduced by Nestle intended for mixing with milk or water, which falls into this category due to its performance metrics.
3. What is the underlying principle of the BCG Matrix?
The BCG Matrix is founded on the principle of assisting companies in analyzing their product portfolios. It does this by categorizing products into four main groups based on their market shares and growth rates in comparison to the largest competitors. These groups are named Cash Cows, Dogs, Question Marks, and Stars, each representing a different strategic business unit’s performance and potential within the company.


