Google, the technology powerhouse, has a diverse portfolio of products and services that have revolutionized the way we search, communicate, and access information. To analyze the performance and potential of these offerings, the BCG Matrix can be a valuable tool. Developed by the Boston Consulting Group, this matrix categorizes products into four quadrants based on their market growth rate and market share. This blog post will explore how the BCG Matrix can help us understand Google’s portfolio and provide insights into the strategic positioning of its various offerings.
BCG Matrix of Google
BCG Matrix of Google
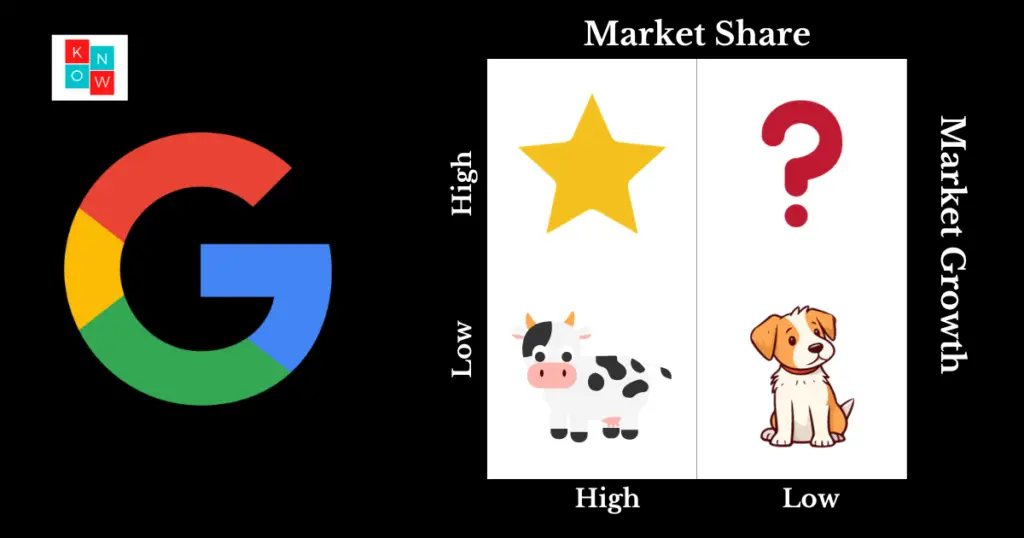
Stars: High Market Share, High Market Growth
In the BCG Matrix, stars represent products or services with a high market share in a rapidly growing market. For Google, its search engine is the ultimate star. With a dominant market share and constant innovation, Google Search continues to grow in both usage and revenue. Additionally, Google’s cloud computing platform, Google Cloud, is also emerging as a star, as it competes with industry giants like Amazon Web Services and Microsoft Azure.
Cash Cows: High Market Share, Low Market Growth
Cash cows are products or services with a high market share in a slow-growth market. Google’s cash cows include its advertising platforms, such as Google Ads and YouTube Ads. These platforms generate significant revenue through targeted advertising, thanks to Google’s vast user base and advanced ad targeting capabilities. Despite their slower growth compared to stars, cash cows provide a steady income stream and act as a financial backbone for Google’s operations.
Question Marks: Low Market Share, High Market Growth
Question marks, also known as problem children, represent products or services with low market share in a rapidly growing market. Google’s question marks can be seen in its various ventures beyond its core offerings. For example, Google’s hardware products like Google Pixel smartphones and Google Home devices initially faced challenges in gaining significant market share. However, these products have the potential to grow rapidly if Google can effectively compete with established players like Apple and Amazon.
Dogs: Low Market Share, Low Market Growth
Dogs refer to products or services with low market share in a slow-growth market. In Google’s case, some of its discontinued or less successful ventures fall into this category. Examples include Google+, its failed social networking platform, and Google Glass, the augmented reality glasses that did not gain widespread adoption. These ventures did not generate substantial market share or growth, leading to their discontinuation or repositioning.
Conclusion
The BCG Matrix analysis provides valuable insights into Google’s portfolio of products and services. It highlights the strength of Google’s search engine and advertising platforms as cash cows, ensuring a stable revenue stream. The matrix also identifies question marks and potential growth areas for Google, such as its hardware ventures and Google Cloud. Additionally, it sheds light on the discontinued products or ventures that did not gain traction, serving as a reminder of the risks associated with innovation and diversification. Overall, the BCG Matrix helps Google assess and strategize its portfolio, ensuring sustainable growth and market leadership in the ever-evolving technology landscape.