BCG Matrix Analysis of Tesla: Assessing Product Portfolio Performance
BCG Matrix, also known as the Boston Consulting Group Matrix, is a strategic tool used to analyze a company’s product portfolio. It categorizes products into four quadrants based on their market growth rate and market share. In this blog, we will conduct a BCG Matrix analysis of Tesla, one of the most renowned electric vehicle (EV) manufacturers in the world. By evaluating Tesla’s product portfolio, we can gain insights into the company’s market position and identify areas for future growth and investment.
BCG Matrix of Tesla
Stars - Tesla Model 3
Stars represent products with high market growth and a high market share. In Tesla’s case, the Model 3 electric sedan falls into this category. Launched in 2017, the Model 3 has become Tesla’s flagship vehicle, accounting for a significant portion of the company’s sales and revenue. With its affordable price and impressive range, the Model 3 has gained immense popularity among consumers worldwide. As the EV market continues to grow, the Model 3 is expected to maintain its star status and contribute to Tesla’s future success.
Question Marks - Tesla Cybertruck
Question marks, also known as problem children, are products with high market growth but a low market share. Tesla’s Cybertruck, an upcoming all-electric pickup truck, falls into this category. Although the Cybertruck has generated significant buzz and excitement, it has yet to be released to the market. As a new product in a highly competitive segment, its success is uncertain. However, if Tesla can capture a substantial market share with the Cybertruck, it has the potential to become a star in the future. The success of the Cybertruck will depend on factors such as pricing, performance, and customer reception.
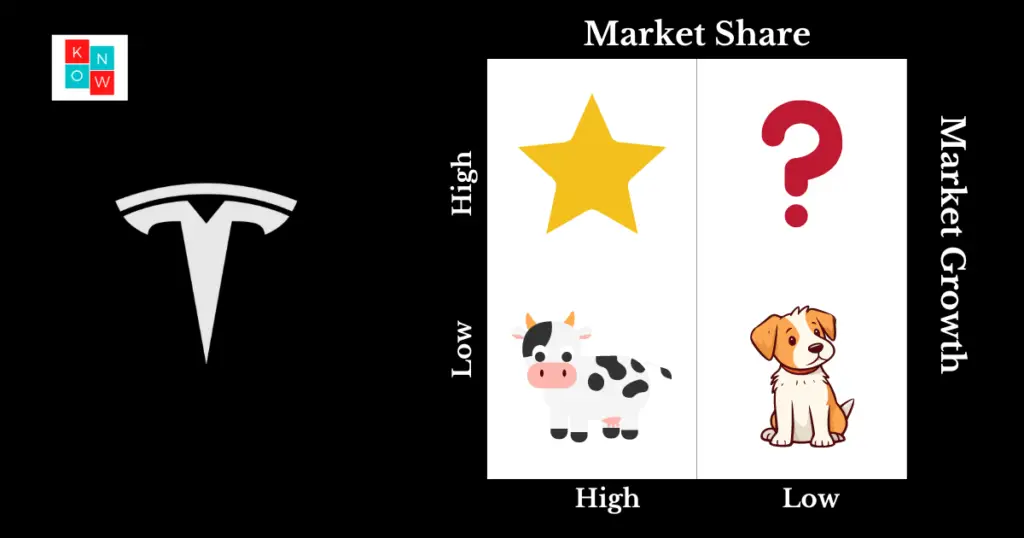
Cash Cows - Tesla Model S and Model X
Cash cows are products with a low market growth rate but a high market share. In Tesla’s product portfolio, the Model S and Model X luxury electric vehicles fall into this category. While these models have been in the market for several years, they continue to generate steady revenue for Tesla. The Model S and Model X cater to a niche market of luxury EV buyers, offering high-performance capabilities and premium features. Although the market growth for these models may be relatively slower compared to newer offerings, they contribute significantly to Tesla’s profitability and cash flow.
Dogs - Tesla Roadster (First Generation)
Dogs represent products with low market growth and a low market share. In Tesla’s case, the first-generation Roadster falls into this category. Although the Roadster played a crucial role in establishing Tesla’s brand and technological prowess, it is no longer in production. The first-generation Roadster had limited sales and a niche market appeal. However, it paved the way for subsequent models and the success of Tesla as a leading EV manufacturer. As a discontinued product, the Roadster does not contribute to Tesla’s current product portfolio.
Conclusion
A BCG Matrix of Tesla’s product portfolio reveals a diverse range of offerings with varying market positions. The Model 3 stands out as a star, driving Tesla’s sales and revenue growth. The Cybertruck represents a question mark, with its market success yet to be determined. The Model S and Model X serve as cash cows, providing steady revenue streams. Finally, the first-generation Roadster is classified as a dog, having played a crucial role in Tesla’s early years but no longer contributing to the current product lineup.
By analyzing its product portfolio using the BCG Matrix, Tesla can make informed decisions regarding resource allocation, investment, and strategic planning. The company can focus on leveraging its stars for continued growth, investing in question marks to turn them into stars, and optimizing cash cows for sustained profitability. Additionally, Tesla can evaluate opportunities to introduce new products or phases out underperforming ones.
It is important to note that the BCG Matrix analysis is a snapshot of Tesla’s product portfolio at a specific time and may evolve as the market dynamics change. Nonetheless, this analysis provides valuable insights into Tesla’s current market position and future growth prospects, helping the company stay competitive and innovative in the dynamic world of electric vehicles.


