Amul, a renowned Indian dairy cooperative, has built a strong presence in the dairy industry over the years. To understand the performance and potential of Amul’s products, we can employ the Boston Consulting Group (BCG) matrix. Introduced by the BCG, this matrix categorizes a company’s products into four quadrants: Stars, Cash Cows, Question Marks, and Dogs. In this blog post, we will delve into the BCG matrix and examine how it can be applied to Amul’s diverse product portfolio.
Understanding BCG Matrix
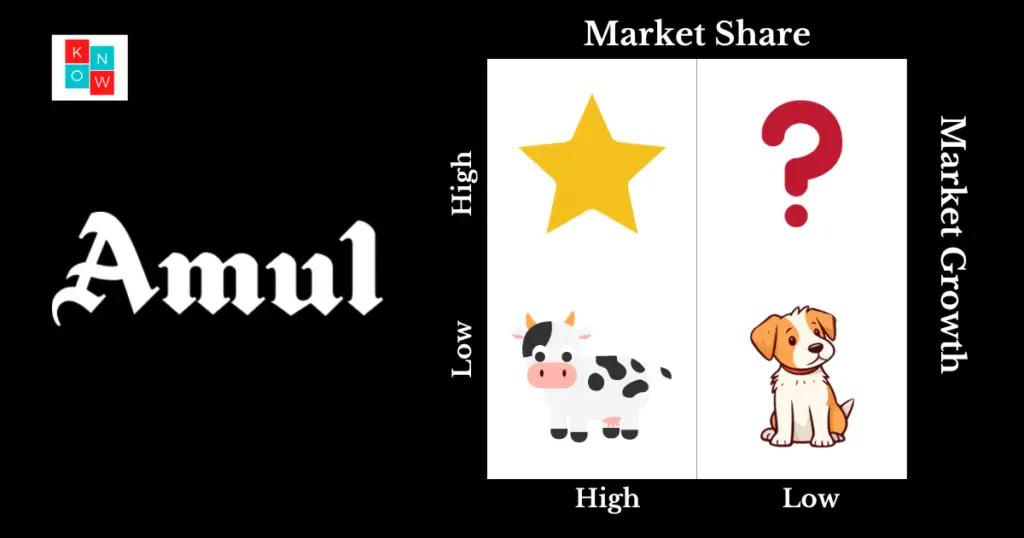
The BCG Matrix, also known as the Boston Consulting Group Matrix, is a strategic management tool that helps businesses analyze and evaluate their portfolio of products or services. It provides a visual representation of a company’s product lines based on two key factors: market growth rate and market share.
The matrix is divided into four quadrants: stars, question marks, cash cows, and dogs. Stars represent products with high market share in rapidly growing markets. These products have the potential to generate significant revenue and should be invested in to maintain their growth.
BCG Matrix of Amul
Question marks are products with low market share in high-growth markets. They require careful consideration as they may have the potential to become stars or may end up being unsuccessful ventures. Decisions regarding investment or divestment should be made based on thorough analysis.
Cash cows are products that have a high market share in mature, slow-growing markets. These products generate steady cash flow and are considered stable sources of income for the company. However, they require minimal investment as their growth potential is limited.
Lastly, dogs represent products with low market share in low-growth markets. They do not generate substantial profits and may even result in losses for the company. It is often recommended to either divest from these products or find ways to turn them into more profitable ventures.
BCG Matrix of Amul
Stars
Stars are high-growth products that have a significant market share. For Amul, its star products would be those with high market growth and a strong market position. One example is Amul Butter, which has maintained its leadership position in the market for several decades. With a loyal customer base and consistent demand, Amul Butter continues to contribute a substantial portion of revenue to the company. Other star products in Amul’s portfolio include Amul Milk, Amul Ice Creams, and Amul Cheese, all of which enjoy a significant market share and consistent growth.
Cash Cows
Cash cows are products that have a high market share but low market growth. These products generate a stable and substantial cash flow for the company. In Amul’s case, its cash cows can be identified as products that have reached their maturity stage but still hold a dominant position in the market. Amul Ghee is a prime example of a cash cow for the company. Ghee has a well-established market in India, and Amul’s brand reputation ensures a steady demand. Other products like Amul Milk Powders and Amul Paneer also fall into this category.
Question Marks
Question marks, or problem children, are products with low market share but high market growth potential. These products require careful consideration and strategic investments to convert them into stars. In Amul’s portfolio, products like Amul Chocolates and Amul Fresh Cream can be categorized as question marks. While these products have the potential for growth, they face intense competition from established players in the market. By investing in marketing campaigns, product innovation, and expanding distribution channels, Amul can maximize the growth potential of these products.
Dogs
Dogs are products that have both low market share and low market growth. These products typically generate minimal profit and may not have a sustainable future. In Amul’s case, it is challenging to identify dogs within its product portfolio due to its strategic focus on core dairy products. However, certain niche products or variants that have failed to gain traction in the market could fall into this category. Constant evaluation and rationalization of such products are crucial to ensure optimal resource allocation.
Conclusion
By using the BCG matrix, we can analyze Amul’s product portfolio and gain valuable insights into the performance and potential of its products. The matrix helps identify stars that contribute significantly to revenue, cash cows that generate stable cash flow, question marks that require strategic investments, and dogs that may need rationalization. Amul’s consistent focus on quality, innovation, and market expansion has been instrumental in maintaining a strong presence in the dairy industry. The BCG matrix serves as a useful tool for Amul to assess its products’ market position and make informed decisions regarding resource allocation and growth strategies.